128
replies
19964 views
Description
Description byCan be used to make Runewords:
Don’t worry about slowdowns, a site this young undergoing constant changes in the form of feature additions, updating vs game patches, lots of “live” data, probably just lots of rows in general all while now under near-enterprise level traffic.
Agreed that it’s not worth diving into atm if reboots fix it — gotta let yourself relax sometimes! Mental health month and everything lol.
Agreed that it’s not worth diving into atm if reboots fix it — gotta let yourself relax sometimes! Mental health month and everything lol.
OP

Sadly, the site got completely annihilated once again during both walks tonight. Americas starting around 3am CEST (again pretty much exactly with the first SoJ sale) and then again during the Europe walk around 7:15 CEST. I for one wasn't able to successfully open a single page for...well, I gave up until now actually and API kept failing (30s timeout) for 15+ minutes during the first, at least 6+ during the second.
Not complaining, just pointing out times/occurrences in the hopes that it may somehow help you address bits and pieces moving forward.
Not complaining, just pointing out times/occurrences in the hopes that it may somehow help you address bits and pieces moving forward.
During the last days performance was often bad for me. A few times I only got error pages or it took pretty long to load a page. Hope can you find and fix the cause.
OP
I have temporarily disabled the 'Online' filter in the browse trades area - I believe it has something to do with the process hanging/bottlenecking as it was left-joining the sessions table (which grows quickly to 300k entries in half a day, sometimes faster than that).
So yeah, temporarily disabled that, cleared sessions, cleared cache, and a full rack restart as well. I also added some extra cacheing to member profile pages, so some stats on there may take 5 minutes to update after any changes.
Want to observe if things get better following this change. If things do get better and I don't have to keep issuing restarts, can deduce whether the online filter in browse trades was indeed causing the issues. If that's the case I'll need to look at it again and rewrite it to be more performant, I already know how I will do this.
Wish the server luck guys
Best of luck, Mr. Server, sir! :p
Deleted User 632
0
Guest
it was pretty good one hour ago. but now it's taking 15-20 seconds to open this forum page.
edit: one min later it's running quick again.
edit: one min later it's running quick again.
Similar experience - sometimes it hangs for a minute or so and eventually loads; inconsistent.
OP
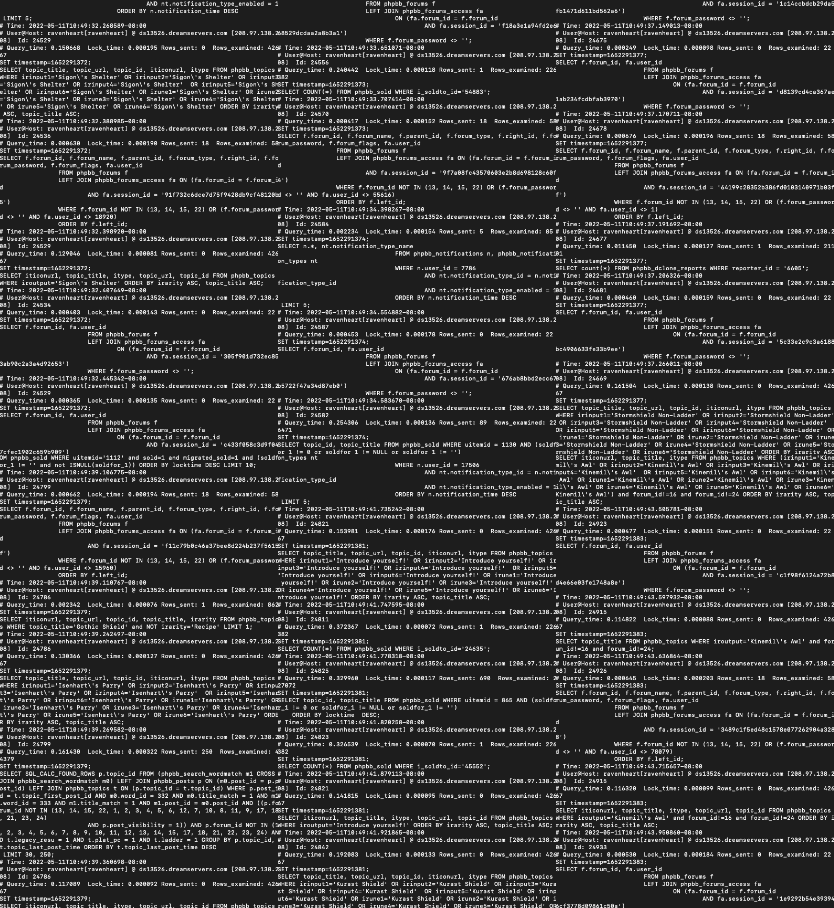
Okay, just disabled an old extension for switching accounts that was firing on every single page load for every single user. I'd forgotten that it was re-enabled for testing. Have restarted again, let's see if that helps.
Edit: Here's what
![Image]()
Edit: Here's what
tailing the mysql slow log looks like. It only logs queries over like 0.001 seconds or something like that, so just imagine what it is actually having to cope with 
Deleted User 632
0
Guest
so this is what server cancer looks like.
it's working good so far.
it's working good so far.
It has been running a lot better for the past hour.
This is by far my favorite trading site, thanks a lot for your hard work.
This is by far my favorite trading site, thanks a lot for your hard work.
+1 to Udyret and Zelym - running better as of last 30 mins.
Running really poorly again, lost of 524/522 errors for the past few hours, same as last night. Need a bigger SQL instance?
Deleted User 632
0
Guest
yea. it's running bad for me also. 30 seconds to several minutes to load now.
Slowness and various server (5xx) errors here as well.
It's quite slow for me too, takes a long time to load or it just hits a server error.
OP
Coming to my wit's end here guys, worked fine before I went to sleep, obviously nothing has changed since the modifications I made yesterday.
It seems that as the sessions table grows and grows the performance also decreases proportionally to it. Whenever I purge that sessions table, the site snaps back into life again. But then as time goes on and that table gets populated again, the site begins to slow, coming to a complete stop about 4 hours later.
So only thing I can draw from that is something in my code is like, querying way too many rows from that table. Or, the table is filling up too quickly.
Sessions table is how the site tracks user timestamps, and therefore things like online indicators, last visits (and therefore read/unread indicators), and a bunch of other stuff work.
I need to review all my commits (and hotfixes) after v1.36 and see what might be causing that to happen. No small feat, we're talking thousands of lines or code here. I'll continue to chop out some stuff later today and see how things play out.
Not to make dumb suggestions that you've already thought of anyways but just from reading that, it kinda got me thinking "so what's a relatively new feature that's related to the online/offline bits?".
Other than the online search you mentioned you already tried, isn't the "seller/author online/offline" indicator light in threads also relatively new and hence a potential cause? Just a thought.
Other than the online search you mentioned you already tried, isn't the "seller/author online/offline" indicator light in threads also relatively new and hence a potential cause? Just a thought.
OP
Update:
Before I decided to start looking at my code again and chopping things off then observing for change, I thought I'd take a look at Cloudflare analytics again.
Surprise surprise, some jackass from China is hitting the dclone API and the dclone tracker page with huge amounts of automated traffic. Most likely a page refresher or scraper of some sort. I think this correlates with the time that things started getting (much) worse?
I set a firewall rule to block traffic from these two networks. Within 1 minute it had already blocked 700+ requests. Within 10 minutes it had blocked 10,000 requests:
10k x 6 = 60k requests per hour
60k x6 = 360k requests per 6 hours
360k has been the typical row count of the sessions table before I've had to purge it (usually 6 hours after the last purge), maybe this is the issue, or a strong component of the issue?
Hoping that this makes a difference and will continue observing analytics before I start looking at potential internal issues again.
Teeb
Similar pages
Advertisment
 Hide ads
Greetings stranger!
You don't appear to be logged in...
99
Who is online
Users browsing Forums: ![]() Baidu [Spider],
Baidu [Spider], ![]() Danzorz,
Danzorz, ![]() dionisy_cn,
dionisy_cn, ![]() Hurricanr,
Hurricanr, ![]() leox,
leox, ![]() PaianganuOm,
PaianganuOm, ![]() PetalBot [Bot] and 284 guests.
PetalBot [Bot] and 284 guests.
No matches

moonlit
95